
Analytics & Reporting Platform for Banks – Discover the Power of Data
Data – the most valuable resource you own

Data sets represent an extraordinary wealth of information about your business and clients. Every uploaded file, each connection generates an ever-increasing amount of information that companies must manage. However, instead of being overwhelmed by the pace of data growth, let’s look at the possibilities they open up. Large amounts of data are primarily a huge opportunity for innovation and development. Thanks to modern data storage and access solutions (such as cloud-based approaches), we have the opportunity for exciting discoveries. To cover that’s needs LiveBank offers a flexible analytics platform embedded inside the application.
Data visualization is a key technique in data analysis on a reporting platform. It involves presenting collected information in graphic form, such as charts, maps, or diagrams. This makes it easier to compare data. By identifying values that deviate from the standard (e.g., the number of customers in queue), it enables a quick response to changing market conditions.
Types of reports on an enterprise analytics platform
Real-time reports
The analysis of ongoing call statistics and other activities is extremely important for the current functioning of the contact center and branches. By monitoring key performance indicators in real-time and reacting quickly to any problems. For example, it is possible to track the current number of calls in the queue, customer wait times, and agent availability. The data collected is crucial for making accurate and strategic business decisions. This allows managers to make quick decisions, such as dynamically assigning tasks or reorganizing work schedules, to optimize customer service.
Historical Reports
When planning and predicting, it`s important to take actions, based on access to the historical statistical analysis data. Identification of long-term trends, patterns, and problems enables strategic decisions in the field of business management. Access to historical data on a business analysis platform allows you to track changes over time, identify seasonal models, evaluate the effectiveness of past actions, and forecast future needs and challenges. A good example is how many specialists should be scheduled to be serviced on particular days of the week.
Digital Analytics platform – How we use your data
Process Improvement thanks to the reporting platform
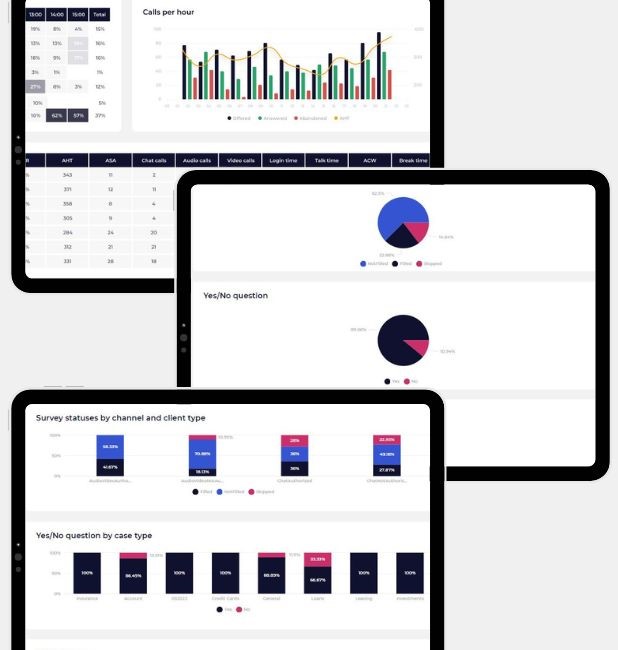
Analyzing interaction data allows for improving service processes. By identifying the areas where the most common problems or delays occur, it is possible to introduce appropriate organizational and training changes. Accessibility to data is aimed at increasing the efficiency and effectiveness of customer service. A perfect example of such a process is the graphical analysis of customer surveys. There are two levels of view here: one for the whole service, e.g. per type of inquiry, and the handling of a specific interaction by the Advisor.
Resource Optimization
Another aspect worth considering is optimizing the use of human and technological resources. By analyzing interaction data, you can identify peak times when additional workforce is needed and the communication channels that are most popular with customers. As a result, you can better plan your staff’s work schedules and invest in the right scaling tools and technologies.
Key Performance Indicators on Business Analytics Platform
When analyzing contact center/branch interaction data, there are a few key metrics to keep track of. Most indicators are like interconnected vessels – changing one impacts the others.
-
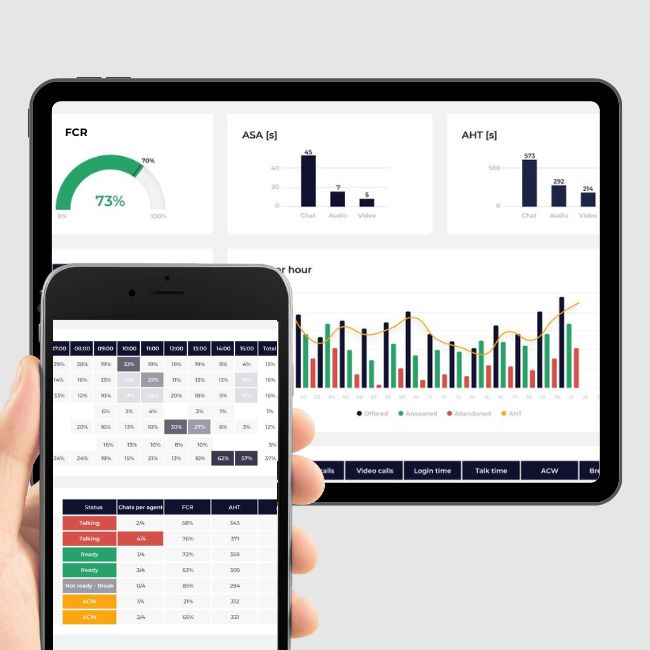
Average Speed of Answer, ASA
Average waiting time for customers to connect with a consultant. The shorter the time, the better. It has a big impact on the Service Level.
-
Average Handling Time, AHT
The average duration of a conversation between a consultant and a client. Too long a talk time to the average may indicate problems in customer service or the need for additional training.
-
First Call Resolution, FCR
The percentage of times a customer’s issue was resolved on the first contact center. This indicator is a measure of the effectiveness of customer service.
-
Service Level, SL
It is an indicator that gives you the number of received calls in a designated time frame. A common metric is 80/20, which means 80% of calls are answered within 20 seconds.
-
Customer Satisfaction, CSAT
The degree of customer satisfaction with the service received in the contact center. Measuring this indicator allows you to assess the quality of customer service and identify areas for improvement.
Business Analytics Platform Summary
– LiveBank provides a wide range of reports that will help you achieve a completely new level of data analysis and management in your company. Generate precise and comprehensive reports quickly and efficiently. Tracking key performance indicators allows you to accurately diagnose situations and make informed decisions.
– Thanks to its ease of use, even people without specialized knowledge of data analysis can benefit from rich reporting features. Visualizing key data makes it easier to understand what it means. Configuration of reports according to your criteria and preferences adapts them to your business requirements. With various graphics and charts, you can quickly spot trends and patterns.
– A significant benefit of our reporting feature is the ability to integrate with other systems and tools, which enables a smooth flow of data between different platforms and eliminates the need to manually rewrite and convert information.
– Thanks to LiveBank, you gain a tool for effective data management and a partner who supports you in making the right decisions. Join us today and discover the full potential of our advanced reporting feature!